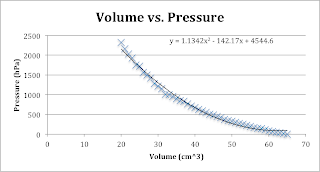
Volume vs. Pressure
experiment
1)
Tables
Volume (mL)
|
Pressure (hPa)
|
65
|
0
|
64
|
20
|
63
|
40
|
62
|
50
|
61
|
70
|
60
|
85
|
59
|
110
|
58
|
140
|
57
|
150
|
56
|
170
|
55
|
200
|
54
|
225
|
53
|
250
|
52
|
275
|
51
|
300
|
50
|
330
|
49
|
350
|
48
|
375
|
47
|
420
|
46
|
450
|
45
|
490
|
44
|
510
|
43
|
550
|
42
|
590
|
41
|
625
|
40
|
675
|
39
|
710
|
38
|
770
|
37
|
830
|
36
|
855
|
35
|
900
|
34
|
955
|
33
|
1000
|
32
|
1010
|
31
|
1150
|
30
|
1220
|
29
|
1285
|
28
|
1425
|
27
|
1500
|
26
|
1560
|
25
|
1720
|
24
|
1750
|
23
|
1930
|
22
|
2030
|
21
|
2160
|
20
|
2325
|
Volume (mL)
|
Pressure (hPa)
|
0.02
|
0.00
|
0.02
|
20.00
|
0.02
|
40.00
|
0.02
|
50.00
|
0.02
|
70.00
|
0.02
|
85.00
|
0.02
|
110.00
|
0.02
|
140.00
|
0.02
|
150.00
|
0.02
|
170.00
|
0.02
|
200.00
|
0.02
|
225.00
|
0.02
|
250.00
|
0.02
|
275.00
|
0.02
|
300.00
|
0.02
|
330.00
|
0.02
|
350.00
|
0.02
|
375.00
|
0.02
|
420.00
|
0.02
|
450.00
|
0.02
|
490.00
|
0.02
|
510.00
|
0.02
|
550.00
|
0.02
|
590.00
|
0.02
|
625.00
|
0.02
|
675.00
|
0.02
|
710.00
|
0.02
|
770.00
|
0.02
|
830.00
|
0.02
|
855.00
|
0.02
|
900.00
|
0.02
|
955.00
|
0.02
|
1000.00
|
0.02
|
1010.00
|
0.02
|
1150.00
|
0.02
|
1220.00
|
0.02
|
1285.00
|
0.02
|
1425.00
|
0.02
|
1500.00
|
0.02
|
1560.00
|
0.03
|
1720.00
|
0.03
|
1750.00
|
0.03
|
1930.00
|
0.03
|
2030.00
|
0.03
|
2160.00
|
0.03
|
2325.00
|
2) Graphs
3) Conclusion
While it’s true that our trend
lines don’t really make sense in the context of the problem; one of them is a
polynomial, we can agree that we can obtain some valuable conclusions by
looking at our graphs. The first one somewhat shows us an exponential function and
although, the second one does too, we can assume that our data points aren’t
extremely reliable and that this function could be considered linear, hence the
linear trend line.
In other words, we see that as the
volume increases, the pressure of the gas-air decreases proportionally. In
fact, volume and pressure are inversely proportional.
This leads us to Boyle’s law, which
says:
This equation proves the exact same
theory as the conclusion above.


Excellent graphs and conclusion but please add an introduction to explain what we were doing.
ResponderEliminar